
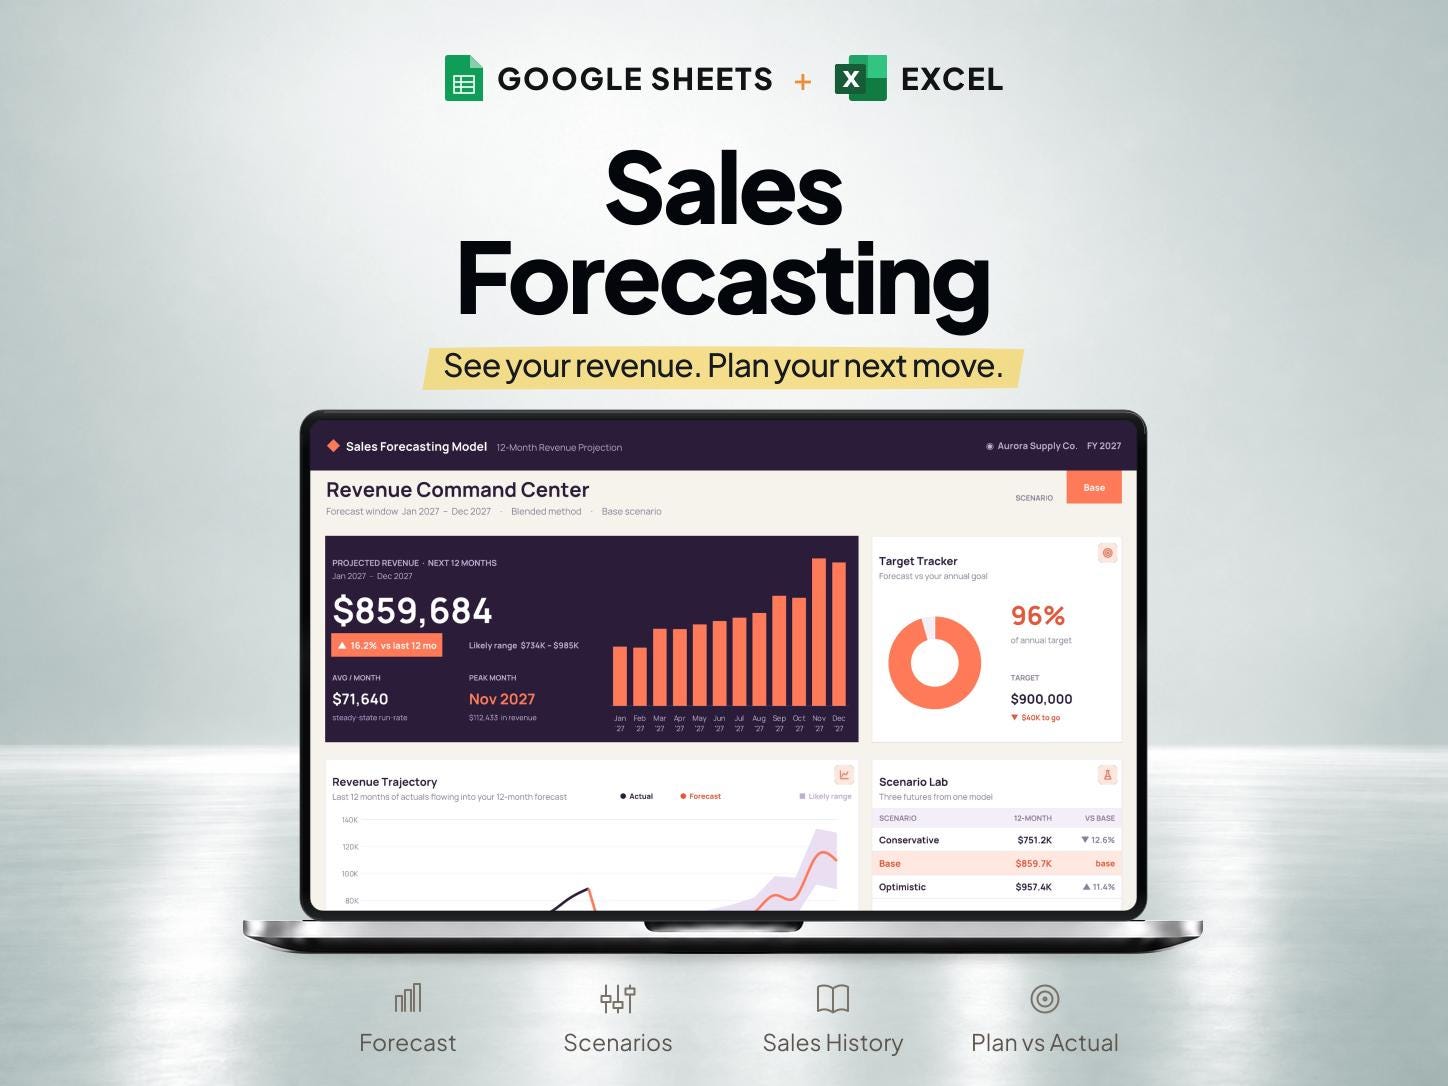
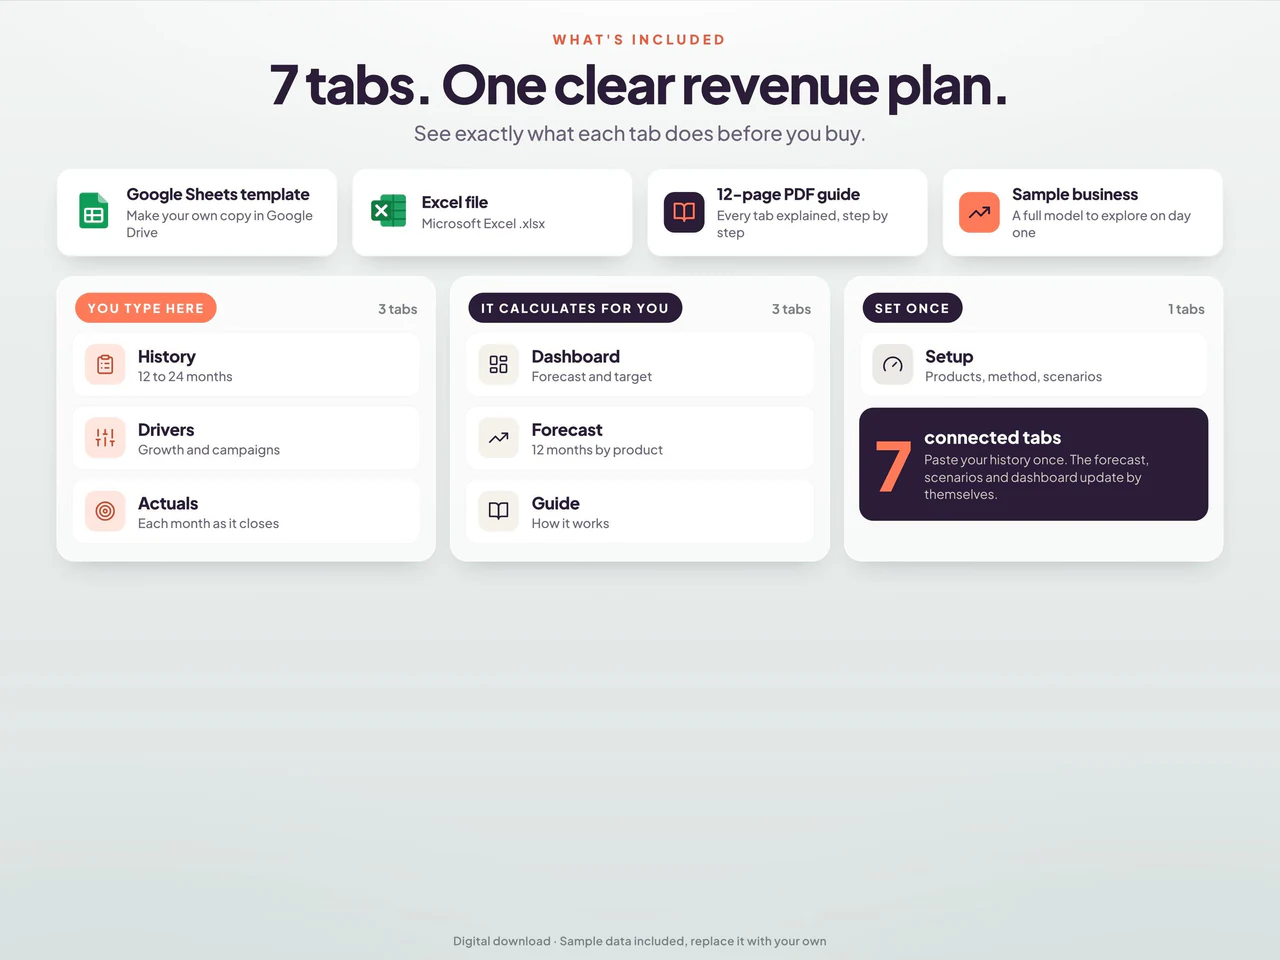
What is included
- Uses 12–24 months of product revenue history to build a twelve-month sales projection.
- Growth-rate, historical-trend and blended methods support editable seasonality and campaign assumptions.
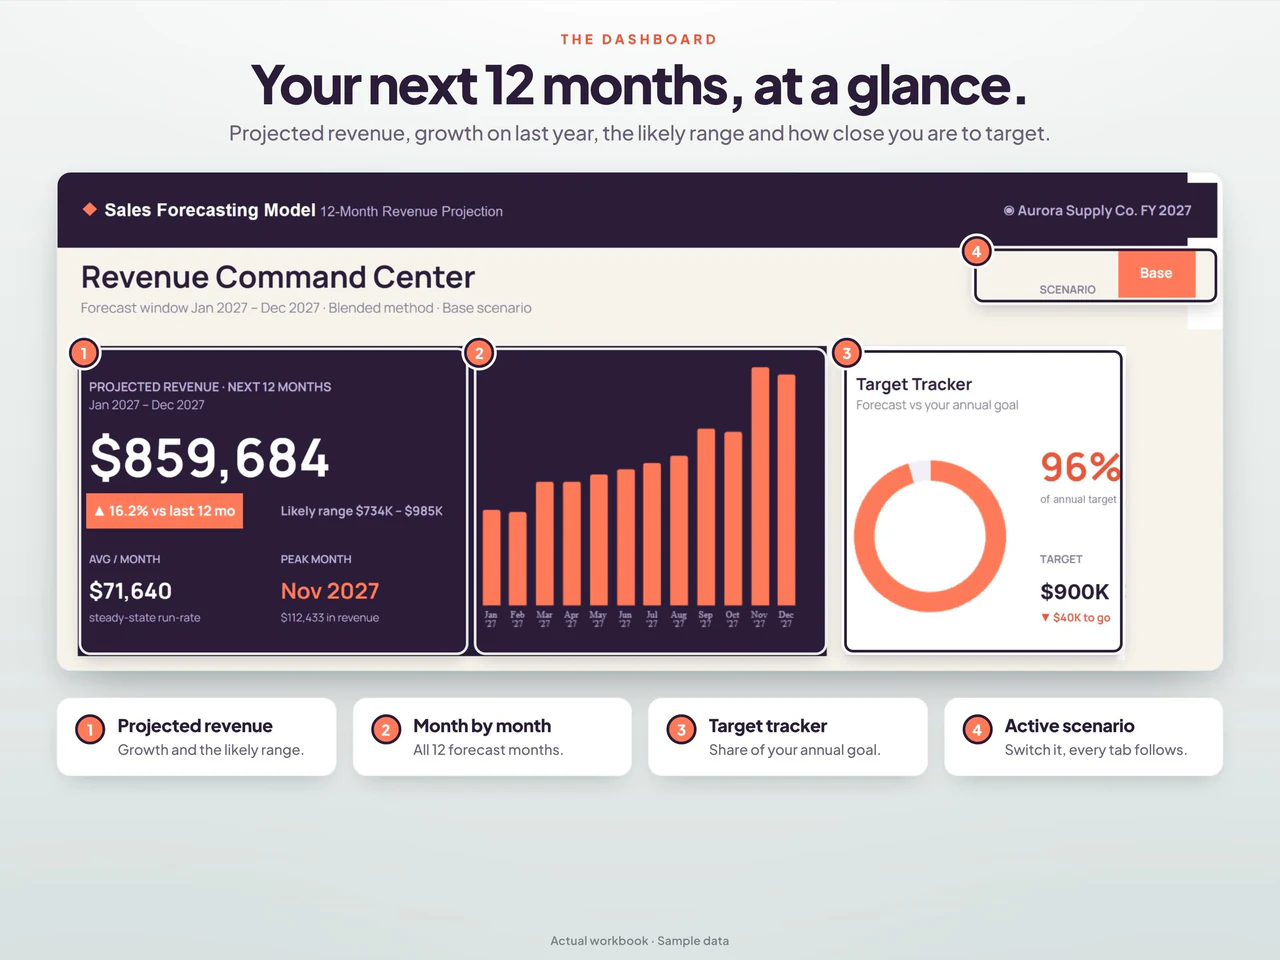
- Three scenarios and actual-versus-forecast comparisons feed the dashboard.
- Includes Google Sheets and desktop Excel; interactive Scenario Studio is Sheets-only, and forecasts are estimates from entered data.
Based on the Etsy listing reviewed October 28, 2026. Check the current listing for any later changes.
What to prepare
For the workflow this product is designed around, gather:
- The twelve-month period to be modeled
- Sales assumptions and their sources
- Past sales records when useful for comparison
A practical way to use your records
Describe the assumptions behind the monthly figures before entering a projection. Keep scenario changes visible so you can explain why a forecast moved. Compare actual results with the forecast using the same definition of sales and the same period.
A worked example
Fictional example: a business compares two growth assumptions after entering its product revenue history in the sales forecast workbook.
- Source history
- 12 months of recorded product revenue
- Controlled starting run-rate
- $4,000 monthly revenue
- Growth comparisons
- 0% versus 10%, with other adjustments held unchanged
- Paste the historical revenue, select the Growth Rate method and document the controlled run-rate and other assumptions used for this comparison.
- Compare one month at zero growth with one month at 10% growth, then retain the assumptions when reviewing later actual revenue.
Result: The simplified first-month comparison is $4,000 versus $4,400, a $400 difference. These are hypothetical revenue assumptions, not secured orders. Actual workbook projections also depend on the selected drivers, seasonality and scenario settings.
Fictional figures explain the workflow; they do not represent customer results or guarantee particular template fields. See the included features above and the current Etsy listing.
A closer look at 12 Month Sales Forecast and Revenue Projection Spreadsheet for Google Sheets & Excel
Additional previews from this product's Etsy listing. Open any image for a larger view.
Questions about this product
How many months does the sales forecast cover?
This is a 12-month sales forecast and revenue projection spreadsheet.
Does a sales forecast predict the business's cash balance?
Sales projections and cash timing are different planning questions. Compare the separate cash-flow products when receipts and outgoing payments are your main focus.
Which spreadsheet formats are listed?
This product is described for Google Sheets and Excel. Confirm the included files, software requirements and delivery instructions on its current Etsy listing.


